As process builder has grown more capable, it has also grown in its ability to consume CPU time. Most of the time, this won’t matter – however, if you aren’t careful, your carefully built process that works just fine with individual records, will blow up spectacularly when you start doing bulk operations. Using the Evaluate Next Criteria option can be a major contributor.
The reason is simple – at this time, one of the greatest consumer of CPU time in processes is the criteria – the rule.
Let’s look at a simple example:
This process has four criteria nodes that divide up states by the size of the state. Each of the criteria has simple formula rule such as this one that identifies the largest states: CONTAINS(‘CA,TX,FL,NY,PA,IL,OH,GA,NC,MI,NJ’, [Lead].State ) . The action calls out to an Apex method that logs consumed CPU time (trust me when I say this action costs very little CPU time).
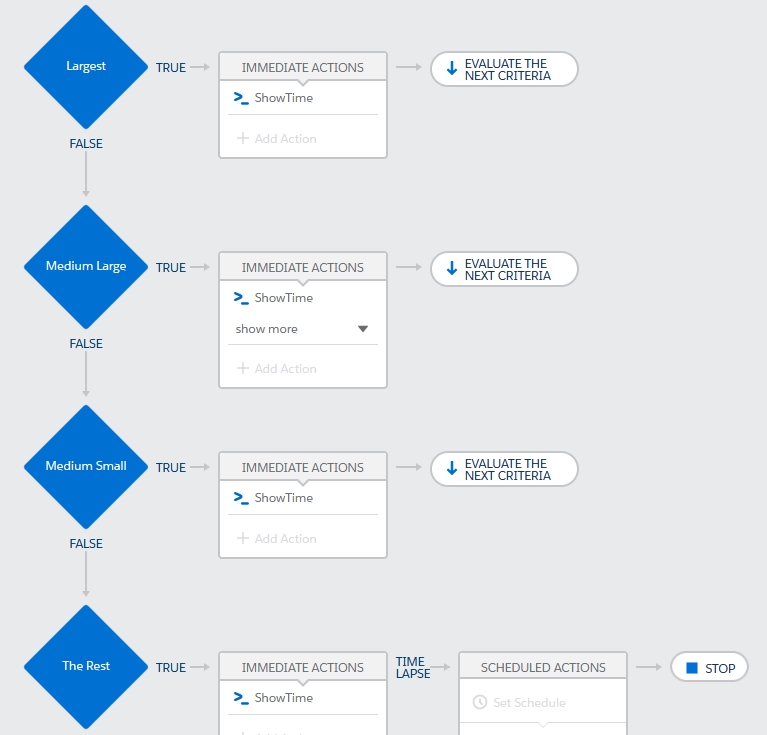
Now imagine inserting 200 leads distributed evenly across all 50 states. With the process as is, all of the leads are evaluated by each node, regardless of the fact that it is impossible for a lead to qualify under more than one criteria (a lead can’t be in two states at once). The average time consumed was 303ms.
Running the same lead insertion after modifying the process to stop after each criteria is met, results in fewer leads being evaluated on each criteria node. In this example, since we distributed the leads equally by state, 75% will be evaluated on the second node, 50% on the third, and the rest on the last. This reduces the average CPU time consumption to 250ms.
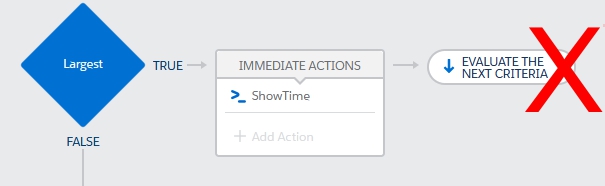
What if all of the records belong to California – in other words, all of them match the first criteria node? In the first process example, where “Evaluate the Next Criteria” is set, there is no difference in CPU time! It still consumes 303ms. This makes sense, as all of the leads are evaluated by each rule.
However, when using the second process that does not evaluate the next criteria, in this scenario only the first criteria is evaluated and the average CPU time drops to 185ms!
Minimizing Rule Execution is an Essential Part of Process Builder Optimization
Executing criteria nodes is costly – by my estimates it runs 75-100ms per criteria against 200 records. When considered in terms of overall CPU time usage, this means that if you execute 100 criteria across multiple processes and sub-processes, that alone may be enough to exceed CPU limits even if nothing else is present in your org (workflows, actions, Apex, validation rules, etc.) – and who has that? Hopefully this will be an area where future optimization work will be done, but for now, it’s essential to design your processes to minimize the number of rules that execute – and stopping evaluation as soon as possible is a great start.
For more ideas on improving overall org performance, especially regarding interactions between Apex and declarative, check out my Pluralsight course “Adopting Trigger Design Patterns in Existing Salesforce Orgs“
Update:
I was asked if this advice contradicts the “One Process to Rule Them All” design pattern of combining multiple processes on an object into one and using the “Evaluate Next Criteria Option” in that case. It does not. There are two reasons why:
1. Combining criteria into one process will cost the same or less CPU time than having it in separate processes.
2. Combining processes into one makes it possible to add an initial negative criteria node – one that stops execution for any record that does not meet any of the subsequent criteria – thus improving efficiency over having multiple processes where each criteria is evaluated for every record.
Methodology
Benchmarking CPU time usage is tricky. I have an entire section in my book “Advanced Apex Programming” about how it’s done, and you can find how those techniques can be applied to declarative constructs in a talk Robert Watson and I did at Dreamforce back in 2016 called “It’s About (CPU) Time – The Dark Art of Benchmarking“. The specific numbers in that talk are long obsolete, but the methodology is sound, and I’ve continued to use it to examine Process Builder. The numbers here were generated on a API 47 scratch org on 2/4/2020. Preliminary testing shows comparable numbers on an API 48 Spring 2020 preview org). Numbers were averaged across 5 tests.


Don’t Evaluate the Next Criteria! is basically suggesting that PB follows a “IF…then…Else If pattern” and not “If then..If then..” . However , there are “business requirements” when multiple PB node criteria needs to be evaluated and related actions be executed. With a “single PB per object and Don’t Evaluate the Next Criteria!” ..how can we achieve the said “business requirement” ?